
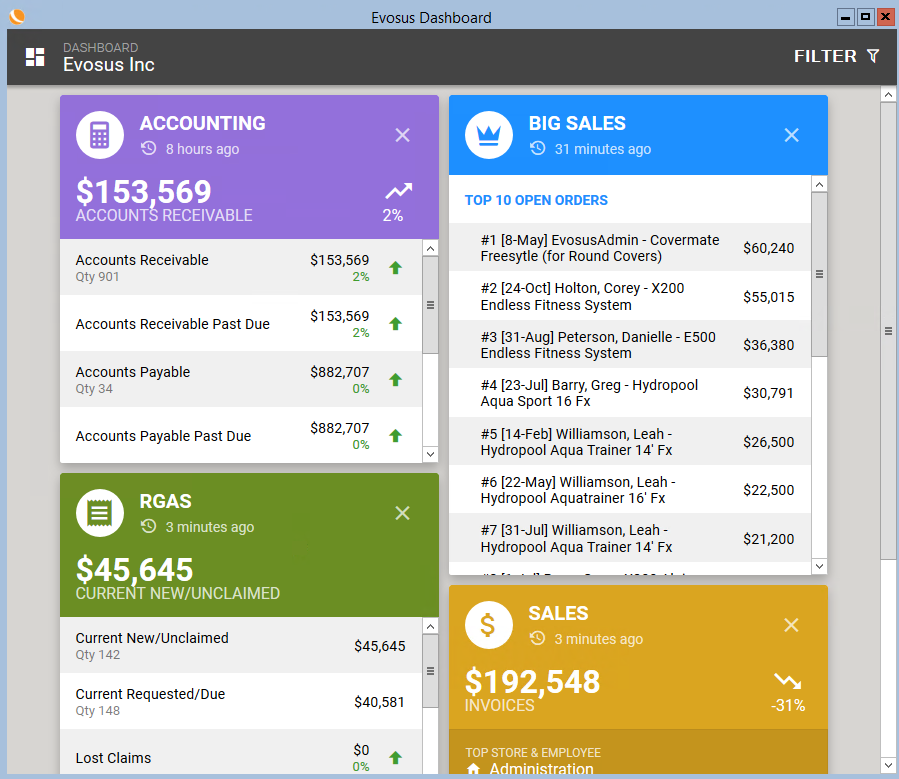
The dashboard gives you a high-level snapshot of your organization. It is all of the key information that you need, in one place.
-
This feature was added to the application in version 6.6.
How do you get to the dashboard?
If you have permission to view the dashboard, it will automatically appear when you log in. You can also open it by selecting Go To > Dashboard.
How do you give users access to the dashboard?
Use the Can access management dashboard security permission to give users access to the dashboard.
-
Add the permission to a group - Use the Security Group screen (Administration > System > Security > Security - Group Level Permissions > Open a group > Click Permissions Tab>Select Management Dashboard>to add the permission to a user group).

-
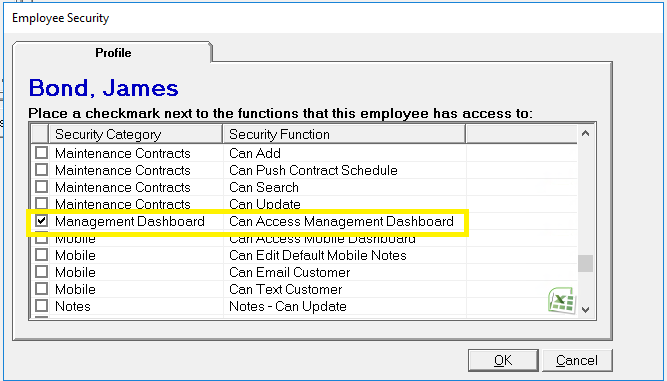
Add the permission to a specific employee - Use the Employee Security screen (Administration > System > Security - Employee Level Permissions > Select an employee > Select Management Dashboard > to add the permission to a specific employee).
How do you remove access to the dashboard?
Use the access management dashboard security permission to take away access to the dashboard (Administration > System > Security - Employee Level Permissions > Select an employee > Uncheck Management Dashboard: Can Access Management Dashboard).
Where does the dashboard information come from?
Wondering which invoices are included on the Sales tile? Just click on the  icon at the top of a tile, and a detailed explanation appears.
How do you change the date range of the dashboard data?
Use the Management Dashboard Data Date Range to Display parameter to determine the date range of the data included in the tiles. This parameter is on the Management Dashboard tab of the System Parameters screen (Administration > System > Evosus Defaults > System Parameters). Select any of the options below.
-
Year to date in the current year versus year to date in the last year.
-
Period over Period - Past 180 days versus previous 180 days (6 months)
-
Period over Period - Past 90 days versus previous 90 days ( 3 months)
-
Period over Period - Past 30 days versus previous 30 days (1 month)
-
Year over Year - Past 180 days in the current year versus the same 180 days in the previous year.
How do you drill down into the dashboard data?
For example, what if you want to see all of your orders, not just the orders included in the Big Sales tile. Just click on the  icon at the top of the Big Sales tile to open the Orders tab of the Sales Manager screen (Administration > Sales > Search Open Orders). You can use this feature to drill down into the numbers and navigate to the source.
When is the dashboard data updated?
The Evosus Daemon service sends the data from your database to a secure cloud service, which then populates the dashboard. That means the Evosus Daemon service must be running properly in order for the dashboard to work.
The Evosus Daemon service sends data to the secure cloud service hourly, every 3 hours, or every 8 hours based on the type of data. You can see when data will be updated using the Evosus Batch Jobs screen (Administration > System > Database > Evosus Batch Jobs).
|
Every 1 Hour |
Every 3 Hours |
Every 8 Hours, but only after 8pm or before 6am |
|---|---|---|
|
|
|
After installing version 6.6, you have to wait 24 hours before using the dashboard
-
You will see a 404 error page if you go to the dashboard immediately after upgrading to version 6.6. The Evosus Daemon service sends the data from your database to a secure cloud service, but it takes about 24 hours before your data will appear in the dashboard.